Monitor CPU and Memory
General Note
Making sure your jobs use the right amount of RAM and the right number of CPUs helps you and others using the clusters use these resources more effeciently, and in turn get work done more quickly. Below are some examples of how to measure your CPU and RAM (aka memory) usage so you can make this happen. Be sure to check the Slurm documentation and the clusters page (especially the partitions and hardware sections) to make sure you are submitting the right jobs to the right hardware.
Future Jobs
If you launch a program by putting /usr/bin/time in front of it, time will watch your program and provide statistics about the resources it used. For example:
[netid@node ~]$ /usr/bin/time -v stress-ng --cpu 8 --timeout 10s
stress-ng: info:  [32574] dispatching hogs: 8 cpu
stress-ng: info:  [32574] successful run completed in 10.08s
    Command being timed: "stress-ng --cpu 8 --timeout 10s"
    User time (seconds): 80.22
    System time (seconds): 0.04
    Percent of CPU this job got: 795%
    Elapsed (wall clock) time (h:mm:ss or m:ss): 0:10.09
    Average shared text size (kbytes): 0
    Average unshared data size (kbytes): 0
    Average stack size (kbytes): 0
    Average total size (kbytes): 0
    Maximum resident set size (kbytes): 6328
    Average resident set size (kbytes): 0
    Major (requiring I/O) page faults: 0
    Minor (reclaiming a frame) page faults: 30799
    Voluntary context switches: 1380
    Involuntary context switches: 68
    Swaps: 0
    File system inputs: 0
    File system outputs: 0
    Socket messages sent: 0
    Socket messages received: 0
    Signals delivered: 0
To know how much RAM your job used (and what jobs like it will need in the future), look at the "Maximum resident set size"
Running Jobs
If your job is already running, you can check on its usage, but will have to wait until it has finished to find the maximum memory and CPU used. The easiest way to check the instantaneous memory and CPU usage of a job is to ssh to a compute node your job is running on. To find the node you should ssh to, run:
[netid@node ~]$ squeue --me
             JOBID PARTITION     NAME     USER ST       TIME  NODES NODELIST(REASON)
          21252409   general    12345    netid   R      32:17     17 c13n[02-04],c14n[05-10],c16n[03-10]
Then use ssh to connect to a node your job is running on from the NODELIST column:
[netid@node ~]$ ssh c13n03
[netid@c13n03 ~]$
Once you are on the compute node, run either ps or top.
ps
ps will give you instantaneous usage every time you run it. Here is some sample ps output:
[netid@bigmem01 ~]$  ps -u$USER -o %cpu,rss,args
%CPU   RSS COMMAND
92.6 79446140 /gpfs/ysm/apps/hpc/Apps/Matlab/R2016b/bin/glnxa64/MATLAB -dmlworker -nodisplay -r distcomp_evaluate_filetask
94.5 80758040 /gpfs/ysm/apps/hpc/Apps/Matlab/R2016b/bin/glnxa64/MATLAB -dmlworker -nodisplay -r distcomp_evaluate_filetask
92.6 79676460 /gpfs/ysm/apps/hpc/Apps/Matlab/R2016b/bin/glnxa64/MATLAB -dmlworker -nodisplay -r distcomp_evaluate_filetask
92.5 81243364 /gpfs/ysm/apps/hpc/Apps/Matlab/R2016b/bin/glnxa64/MATLAB -dmlworker -nodisplay -r distcomp_evaluate_filetask
93.8 80799668 /gpfs/ysm/apps/hpc/Apps/Matlab/R2016b/bin/glnxa64/MATLAB -dmlworker -nodisplay -r distcomp_evaluate_filetask
ps reports memory used in kilobytes, so each of the 5 matlab processes is using ~77GiB of RAM. They are also using most of 5 cores, so future jobs like this should request 5 CPUs.
top
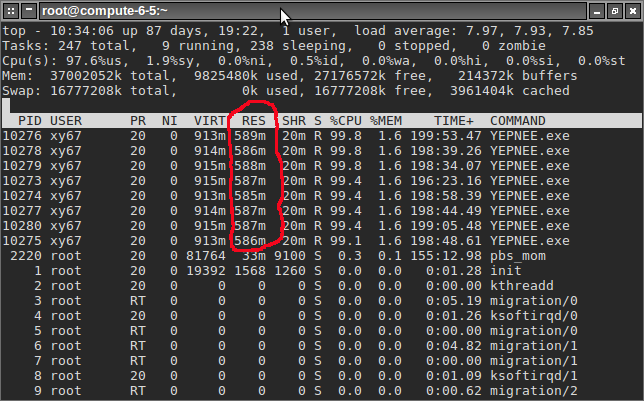
top runs interactively and shows you live usage statistics. You can press u, enter your netid, then enter to filter just your processes. For Memory usage, the number you are interested in is RES. In the case below, the YEPNEE.exe programs are each consuming ~600MB of memory and each fully utilizing one CPU. You can press ? for help and q to quit.
ClusterShell
For multi-node jobs clush can be very useful. Please see our guide on how to set up and use ClusterShell.
Completed Jobs
Slurm records statistics for every job, including how much memory and CPU was used.
seff
After the job completes, you can run seff <jobid> to get some useful information about your job, including the memory used and what percent of your allocated memory that amounts to.
[netid@node ~]$ seff 21294645
Job ID: 21294645
Cluster: mccleary
User/Group: rdb9/support
State: COMPLETED (exit code 0)
Cores: 1
CPU Utilized: 00:15:55
CPU Efficiency: 17.04% of 01:33:23 core-walltime
Job Wall-clock time: 01:33:23
Memory Utilized: 446.20 MB
Memory Efficiency: 8.71% of 5.00 GiB
seff-array
For job arrays (see here for details) it is helpful to
look at statistics for how resources are used by each element of the array.
The seff-array tool takes the job ID of the array and then calculates the distribution and average CPU and memory usage:
[netid@node ~]$ seff-array 43283382
========== Max Memory Usage ==========
# NumSamples = 90; Min = 896.29 MB; Max = 900.48 MB
# Mean = 897.77 MB; Variance = 0.40 MB;                   SD = 0.63 MB; Median 897.78 MB
# each ∎ represents a count of 1
  806.6628 -   896.7108 MB [   2]: ∎∎
  896.7108 -   897.1296 MB [   9]: ∎∎∎∎∎∎∎∎∎
  897.1296 -   897.5484 MB [  21]: ∎∎∎∎∎∎∎∎∎∎∎∎∎∎∎∎∎∎∎∎∎
  897.5484 -   897.9672 MB [  34]: ∎∎∎∎∎∎∎∎∎∎∎∎∎∎∎∎∎∎∎∎∎∎∎∎∎∎∎∎∎∎∎∎∎∎
  897.9672 -   898.3860 MB [  15]: ∎∎∎∎∎∎∎∎∎∎∎∎∎∎∎
  898.3860 -   898.8048 MB [   4]: ∎∎∎∎
  898.8048 -   899.2236 MB [   1]: ∎
  899.2236 -   899.6424 MB [   3]: ∎∎∎
  899.6424 -   900.0612 MB [   0]:
  900.0612 -   900.4800 MB [   1]: ∎
The requested memory was 2000MB.

========== Elapsed Time ==========
# NumSamples = 90; Min = 00:03:25.0; Max = 00:07:24.0
# Mean = 00:05:45.0; SD = 00:01:39.0; Median 00:06:44.0
# each ∎ represents a count of 1
00:03:5.0  - 00:03:48.0 [  30]: ∎∎∎∎∎∎∎∎∎∎∎∎∎∎∎∎∎∎∎∎∎∎∎∎∎∎∎∎∎∎
00:03:48.0 - 00:04:11.0 [   0]:
00:04:11.0 - 00:04:34.0 [   0]:
00:04:34.0 - 00:04:57.0 [   0]:
00:04:57.0 - 00:05:20.0 [   0]:
00:05:20.0 - 00:05:43.0 [   0]:
00:05:43.0 - 00:06:6.0  [   0]:
00:06:6.0  - 00:06:29.0 [   0]:
00:06:29.0 - 00:06:52.0 [  30]: ∎∎∎∎∎∎∎∎∎∎∎∎∎∎∎∎∎∎∎∎∎∎∎∎∎∎∎∎∎∎
00:06:52.0 - 00:07:15.0 [  28]: ∎∎∎∎∎∎∎∎∎∎∎∎∎∎∎∎∎∎∎∎∎∎∎∎∎∎∎∎
********************************************************************************
The requested runtime was 01:00:00.
The average runtime was 00:05:45.0.
Requesting less time would allow jobs to run more quickly.
********************************************************************************
This shows how efficiently the resource request was for all the jobs in an array. In this example, we see that the average memory usage was just under 1GiB, which is reasonable for the 2GiB requested. However, the requested runtime was for an hour, while the jobs only ran for six minutes. These jobs could have been scheduled more quickly if a more accurate runtime was specified.
sacct
You can also use the more flexible sacct to get that info, along with other more advanced job queries. Unfortunately, the default output from sacct is not as useful. We recommend setting an environment variable to customize the output.
[netid@node ~]$ export SACCT_FORMAT="JobID%20,JobName,User,Partition,NodeList,Elapsed,State,ExitCode,MaxRSS,AllocTRES%32"
[netid@node ~]$ sacct -j 21294645
               JobID    JobName      User  Partition        NodeList    Elapsed      State ExitCode     MaxRSS                        AllocTRES
-------------------- ---------- --------- ---------- --------------- ---------- ---------- -------- ---------- --------------------------------
            21294645       bash      rdb9 interacti+          c06n09   01:33:23  COMPLETED      0:0               cpu=1,mem=5G,node=1,billing=1
     21294645.extern     extern                               c06n09   01:33:23  COMPLETED      0:0       716K    cpu=1,mem=5G,node=1,billing=1
          21294645.0       bash                               c06n09   01:33:23  COMPLETED      0:0    456908K              cpu=1,mem=5G,node=1
You should look at the MaxRSS value to see your memory usage.