Monitor Overall Slurm Usage
To enable research groups to monitor their combined utilization of cluster resources, we have developed a suite of getusage tools.
We perform nightly queries of Slurm's database to aggregate usage (in ServiceUnit-hours su_hours) broken down by user, account, and partition.
Service Units are a weighted combination of CPUs, memory, and GPUs allocated for each job.
The relative weights are derived from the approximate cost of these different resources.
| Type | Subtype | Service Units |
|---|---|---|
| Compute Hour* | - | 1 |
| GPU Hour | A5000 | 15 |
| GPU Hour | RTX5000 Ada | 15 |
| GPU Hour | RTX6000 Blackwell | 65 |
| GPU Hour | A100 | 100 |
| GPU Hour | H200 | 300 |
| GPU Hour | B200 | 370 |
* Number of SUs per non-GPU compute job is the maximum of the CPU core count and the total RAM allocation/15GB.
Usage data are available through each cluster's Open OnDemand and as a command-line utility.
Open OnDemand Web-app
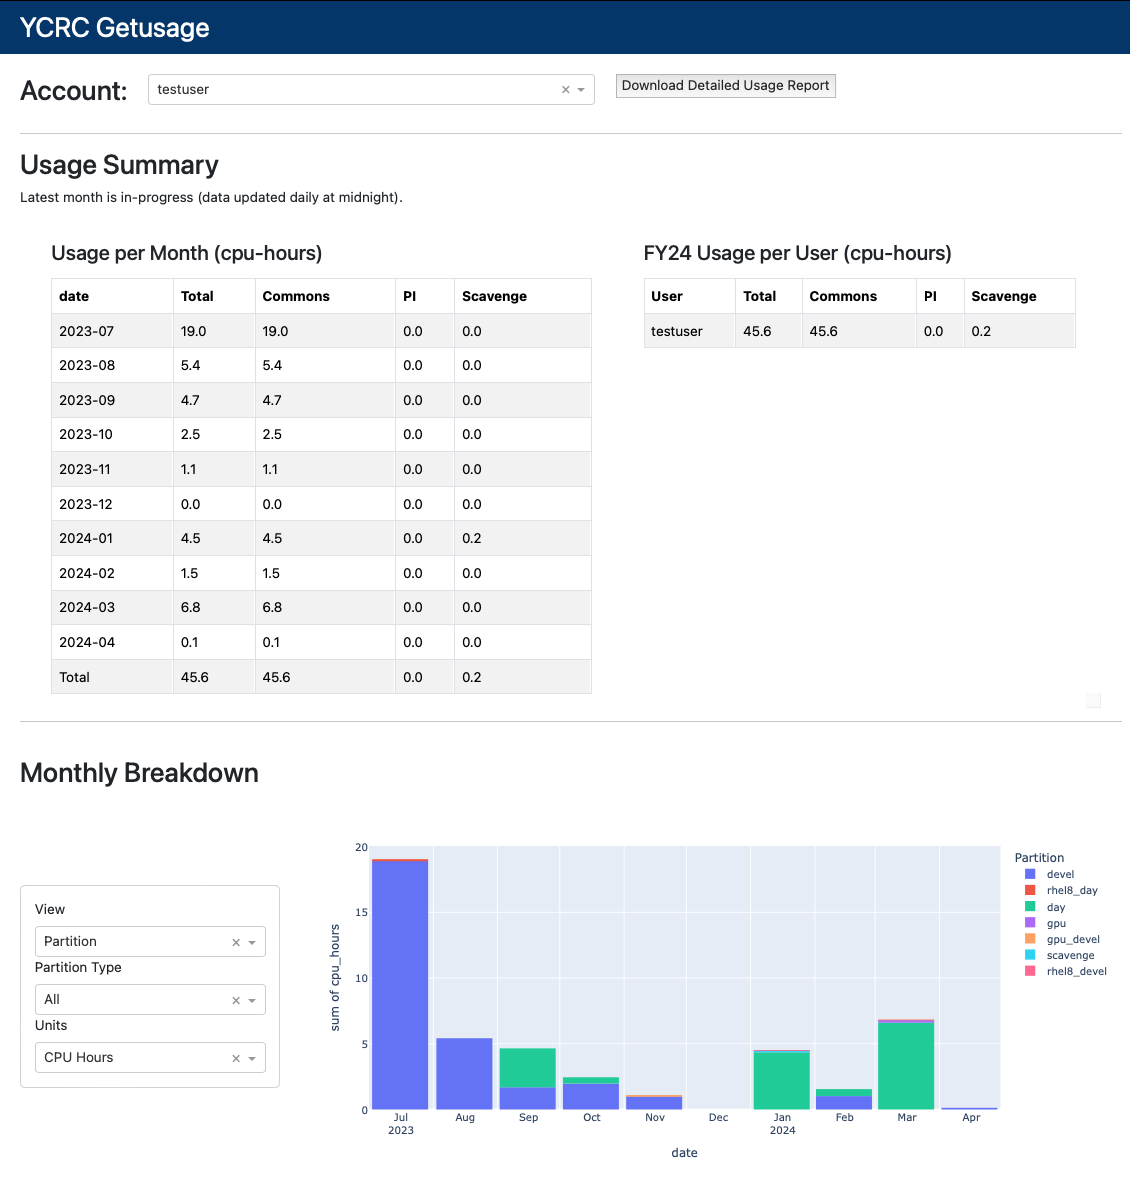
The Open OnDemand User Portals host an interactive data dashboard that provides tables and visualization of Slurm utilization.
An example of such a view is shown below.
Multiple Accounts
If you belong to multiple Slurm Accounts, including priority tier accounts, these will be populated in the pull-down Account menu.
Command-line getusage
These aggregates are collected from all clusters and made accessible to researchers by running getusage:
[testuser@login1.bouchet ~]$ getusage --help

 Usage: getusage [OPTIONS]

 Query cluster SU usage for a user or Slurm account.

╭─ Options ────────────────────────────────────────────────────────────────────╮
│ --user     -u      TEXT     NetID to query. Defaults to $USER.               │
│                             [default: None]                                  │
│ --account  -A      TEXT     Slurm account to query. [default: None]          │
│ --fy       -y      INTEGER  Fiscal year end (e.g. 26 for FY26 = Jul 2025–Jun │
│                             2026). Defaults to current FY.                   │
│                             [default: None]                                  │
│ --cluster  -C      TEXT     Filter to a specific cluster. [default: None]    │
│ --json                      Output raw data as JSON instead of a table (for  │
│                             programmatic use).                               │
│ --help                      Show this message and exit.                      │
╰──────────────────────────────────────────────────────────────────────────────╯
Multiple Accounts
If you belong to multiple accounts, you can specify them with the -A flag.
By default, getusage displays information about your "default" Slurm Account.
If you wish to view your secondary account's usage (or for priority tier accounts, specify them like: getusage -A prio_account
Running without any arguments produces a report for the full fiscal year (starting in July):
[testuser@login1.bouchet ~]$ getusage

testuser  |  FY27  |  SU Hours
======================================================================
  Account                  2026-07     2026-08     2026-09       Total
  --------------------------------------------------------------------
  support                  1,039.3       570.0       466.1     2,075.4
  --------------------------------------------------------------------
  Total                    1,039.3       570.0       466.1     2,075.4
Please reach out to research.computing@yale.edu with any comments or suggestions about how we can improve getusage.