Job Performance Monitoring
We have recently deployed a new tool for measuring and monitoring job performance called jobstats.
Available on all clusters, jobstats provides a report of the utilization of CPU, Memory, and GPU resources for in-progress and recently completed jobs.
To generate the report simply run (replacing the ID number of the job in question):
[ab123@grace ~]$ jobstats 123456789
================================================================================
                              Slurm Job Statistics
================================================================================
         Job ID: 123456789
  NetID/Account: ab123/group
       Job Name: gpu_job
          State: RUNNING
          Nodes: 1
      CPU Cores: 1
     CPU Memory: 5GB
           GPUs: 1
  QOS/Partition: normal/gpu
        Cluster: grace
     Start Time: Tue Nov 26, 2024 at 2:10 PM
       Run Time: 20:09:56 (in progress)
     Time Limit: 2-00:00:00

                              Overall Utilization
================================================================================
  CPU utilization  [||||||||||||||||||||||||||||||||||||||||||||||100%]
  CPU memory usage [                                                1%]
  GPU utilization  [|||||||||||||||||||||||||||||||||||||||||||||||98%]
  GPU memory usage [|                                               3%]

                              Detailed Utilization
================================================================================
  CPU utilization per node (CPU time used/run time)
      r808u11n01: 20:07:01/20:09:56 (efficiency=99.8%)

  CPU memory usage per node - used/allocated
      r808u11n01: 32.4MB/5.0GB (32.4MB/5.0GB per core of 1)

  GPU utilization per node
      r808u11n01 (GPU 1): 98.3%

  GPU memory usage per node - maximum used/total
      r808u11n01 (GPU 1): 689.6MB/24.0GB (2.8%)

                                     Notes
================================================================================
  * Have a nice day!
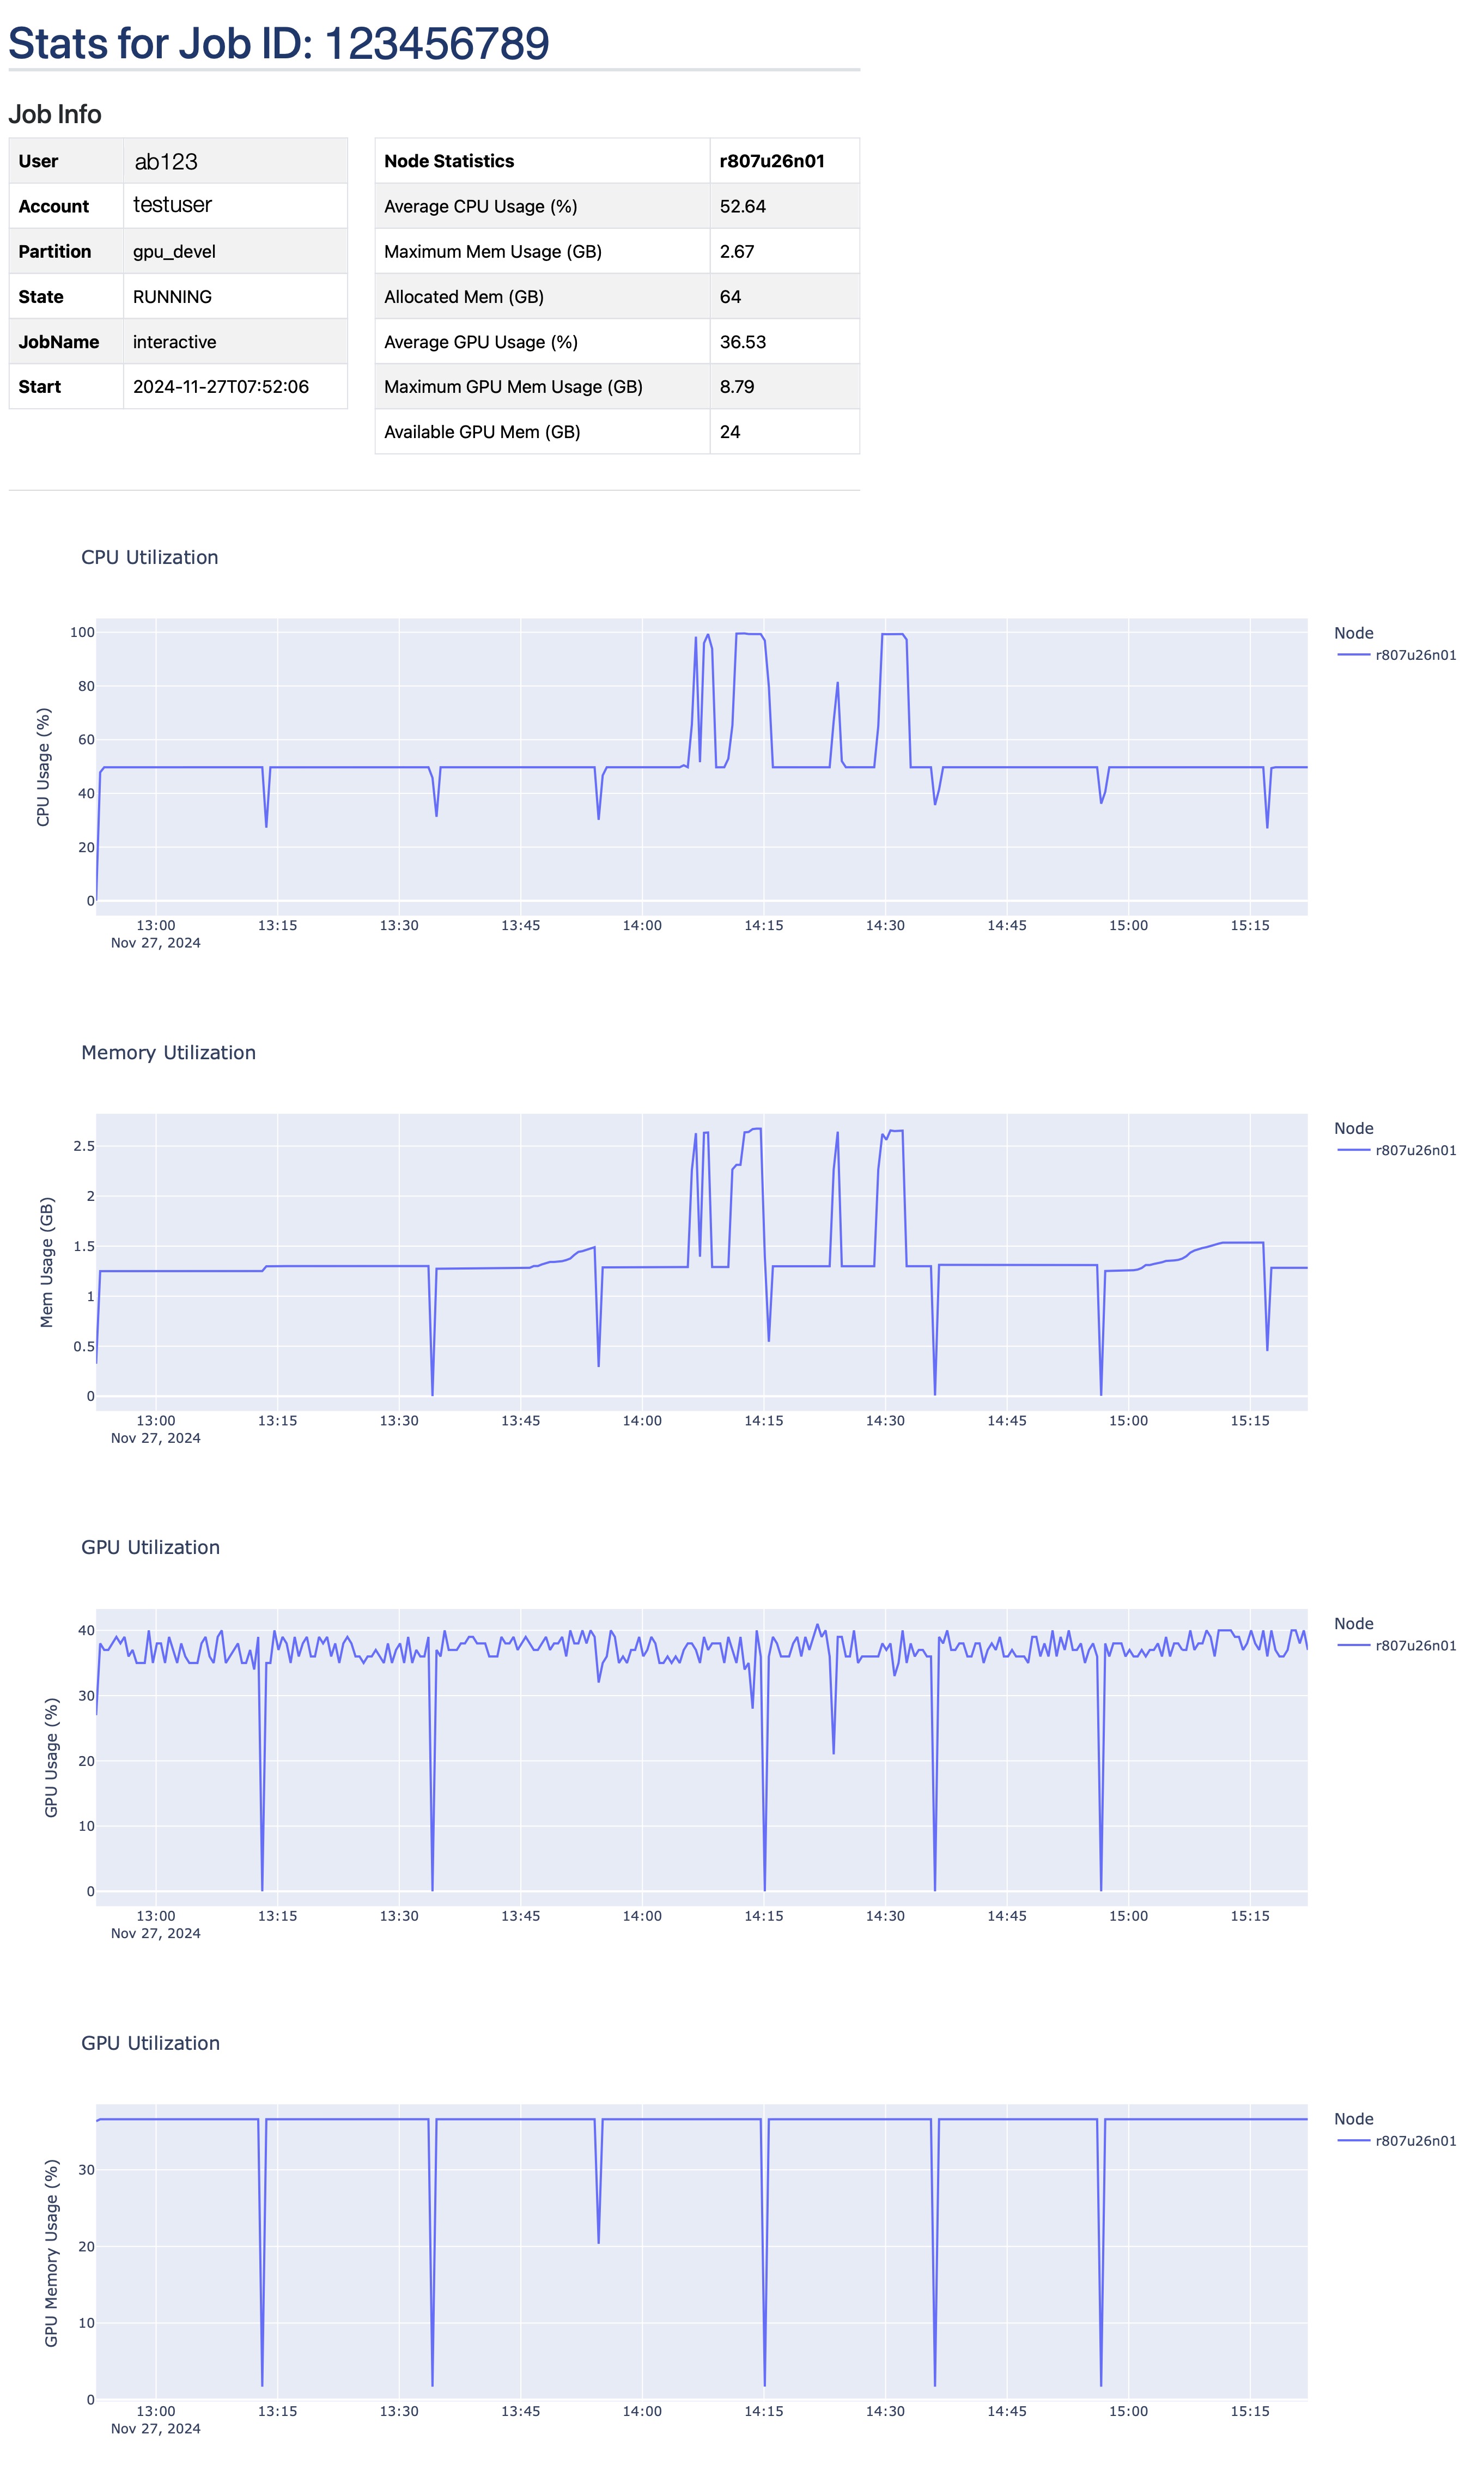
When viewed from our User portal graphical interface, these statistics are enhanced with plots of performance over time.

This is a great way to monitor your job's behavior and resource utilization over time.
Last update: April 22, 2025